Anna Fabrizio
Electronic Journal - Capstone Weekly Updates
Week of: Sep 28 - Oct 4
- Ran trials 7 and 8 with Octopus 1 (1 blind, 1 visual)
*Results: no choice for either trial
- Collected more shore crabs for feeding
- Weighed new octopus (Octopus 2): 140g, female
- Started Octopus 2 on feeding schedule
Week of: Oct 5 - 11
- Ran trial 9 with Octopus 1 (visual)
*Results: Crab choice; total time (00:11:33) but quick decision (< 5 secs)
- Ran trial 1 with Octopus 2 (visual)
*Results: no choice
- had tank trouble this week causing a delay in trials
- moved tank to new location
Week of: Oct 12 - 18
- Ran trial 10 with Octopus 1 (visual)
*Results: Crab choice; total time (00:10:06) but lengthy decision (00:00:22)
- Ran trial 2 with Octopus 2 (visual)
*Results: Crab choice; total time (00:29:20), lengthy choice (00:02:04)
- more tank trouble and scheduling issues, delaying trials
Week of: Oct 19 - 25
- Ran trials 3 and 4 with Octopus 2 (1 blind, 1 visual)
*Results: no choice for either trial
- Scheduling issues and aquarium maintenance prevented any trials to be run with Octopus 1
Week of: Oct 26 - Nov 1
- Ran trials 11 and 12 (final trials) with Octopus 1 (2 blind)
*Results: Trial 12, no choice; Trial 11 resulted in crab choice; total time (00:05:15), choice time (00:00:30)
- It is highly likely that the positive choice exhibited in Trial 11 is due to conditioning.
- Ran trials 5 and 6 with Octopus 2 (1 blind, 1 visual)
*Results: no choice for either
- Octopus 2 has begun to exhibit really aggressive behavior and spends trial periods interacting with researcher.
Week of: Nov 2 - 8
- Ran trial 7 (final trial) with Octopus 2 (blind)
*Results: no choice
- Took Octopus 2 off feeding schedule; will not use Octopus 2 for further research
Week of: Nov 9-15
- Began lab work in FISH 441 with Hemigrapsus spp.
*Collected water samples from stressed/unstressed live crabs
*Extracted gill tissue from stressed/unstressed crabs to analyze protein and DNA expression
Summary
A stress experiment was conducted using 12 Hemigrapsus spp. crabs (6 stressed, 6 control). Water samples from live crab excretions were collected and then gill tissue was removed and fixed to isolate RNA and extract protein.
Procedures
Experimentation
12 crabs of similar size were selected from the collected individuals (6 control, 6 stressed). The control crabs were placed in individual 25 mL beakers which had 13 mL of filtered sea water in them. The beakers were placed in a tray with ice to keep the water cool so as to minimize heat stress. The experimental crabs were placed in a salad spinner and vigorously spun for 2.5 minutes. Then, the experimental crabs were removed and put into individual 25 mL beakers with 13 mL of filtered sea water. Both groups were allowed to sit for an hour to allow for crabs to excrete any compounds. After an hour, the water samples were put in 15 mL conical tubes and frozen at -20C.
After the hour, the crabs were killed to halt metabolism and any other biological processes. The crabs were dissected and the gill tissue removed. One gill from each animal was used for RNA isolation and one gill was used for protein extraction.
RNA isolation
About 0.015g of gill tissue per animal was placed in a 1.5 mL snap cap tube and 500 μL of Tri-Reagent was added to each tube. The tissue was then homogenized with a disposable pestle. Another 500 μL of Tri-Reagent was added to each tube and the tube was vortexed for 15 seconds. The tubes were then stored at -80C.
Protein extraction
About 0.015g of gill tissue per animal was added to a 1.5 mL snap cap tube with 0.5 mL of CelLytic MT solution. The tissue was homogenized with a disposable pestle. Then the tubes were put in a refrigerated microfuge for 10 minutes at maximum speed (14 rpm). After 10 minutes, the tubes were removed and the supernatant was extracted. The tubes were then stored at -20C.
Measurements/Results
None for this stage.
Conclusions/Next steps
Next week I will quantify the protein samples using a Bradford Assay, analyze the chemical content of the water samples, and continue with RNA isolation and quantification. I will also try to run an SDS-PAGE gel, if time allows.
Week of Nov 16-22
-Lab work: Protein quantification and protein gel preparation
Summary
The protein extractions were quantified using a Bradford Assay and calculations and dilutions were done in preparation to run an SDS-PAGE gel.
Procedures
Protein quantification
Protein samples were diluted 1:2 by pipetting 15 μL of sample into a tube and adding 15 μL of DI water. A blank was made by adding 30 μL of DI water to another tube. Then 1.5 mL of Bradford reagent was added to all tubes. The tubes were then inverted and incubated at RT for 10 minutes. 1 mL of the "blank" tube was transferred to a cuvette. The spectrophotometer was zeroed using the blank sample. The sample tubes were mixed and 1 mL was added of each tube to 12 different cuvettes. The absorbance of the samples were measured at 595nm twice and averaged. The protein concentrations were back-calculated using the standard curve provided. (NOTE: Some lab error caused the protein samples to sit out for more than 10 minutes before analysis.)
Protein sample dilution (in preparation for protein gel)
After the protein sample concentrations were calculated, the samples were standardized in preparation for the protein gel. The lowest protein concentration was used as the standard. Using the equation C1*V1=C2*V2, the amount of the protein sample to be transferred and diluted was calculated. Then, 15 μL of the sample dilutions were transferred to tubes with 15 μL of 2X Reducing Sample Buffer.
Measurements/Results
Spectrophotometer readings (@ 595nm)
| Reading #1 |
Reading #2 |
Avg |
[protein] |
|
| S1 |
0.062 |
0.060 |
0.061 |
123.5 |
| S2 |
0.058 |
0.055 |
0.0565 |
114.4 |
| S3 |
0.040 |
0.040 |
0.04 |
81.0 |
| S4 |
0.047 |
0.047 |
0.047 |
95.1 |
| S5 |
0.065 |
0.066 |
0.0655 |
132.6 |
| S6 |
0.050 |
0.052 |
0.051 |
103.21 |
| C1 |
0.013 |
0.014 |
0.0135 |
27.3 |
| C2 |
0.060 |
0.059 |
0.0595 |
120.4 |
| C3 |
0.010 |
0.013 |
0.0115 |
23.3 |
| C4 |
0.029 |
0.027 |
0.028 |
56.7 |
| C5 |
0.045 |
0.046 |
0.0455 |
92.08 |
| C6 |
0.043 |
0.041 |
0.042 |
85.0 |
Dilution measurments (using C1V1=C2V2 where C1= conc., C2=23.3, and V1=20 uL)
| Conc. |
Volume |
H20 |
|
| S1 |
123.5 |
4 |
16 |
| S2 |
114.4 |
4 |
16 |
| S3 |
81.0 |
6 |
14 |
| S4 |
95.1 |
5 |
15 |
| S5 |
132.6 |
3.5 |
16.5 |
| S6 |
103.2 |
4.5 |
15.5 |
| C1 |
27.3 |
20 |
- |
| C2 |
120.4 |
4 |
16 |
| C3 |
23.3 |
20 |
- |
| C4 |
56.7 |
8 |
12 |
| C5 |
92.08 |
5 |
15 |
| C6 |
85.0 |
5.5 |
14.5 |
Next week I will run the SDS-PAGE gel and finish RNA isolation and quantification.
Week of Nov 23-29
- Lab work: Protein gel
Summary
A protein gel was run using the protein samples from last week.
Procedures
In screw cap tubes, 15 uL of the undiluted protein sample and 15 uL of 2X Reducing buffer were combined for each sample. Then the samples were boiled for 5 minutes. The SDS-PAGE gel box was put together while the samples were boiling and the wells were rinsed thoroughly. Immediately after 5 mins of boiling, the samples were centrifuged for 1 minute to pool the liquid. Then 10 uL of a molecular ladder was added to the first well. Then all 30 uL of each sample was added to each well. The lid was put on and the gel was run for 30 minutes at 150 V. After 30 min, the gel was removed from the box and added to a container containing Coomassie Stain. The gel was allowed to sit in the stain for 5 min on a shaker/rocker. Then, the stain was poured back into the original container and the gel was rinsed briefly (twice) with 10% acetic acid. Then it was immersed in acetic acid and allowed to sit overnight on a shaker/rocker. The next day, pictures were taken of the gel.
Measurements/Results
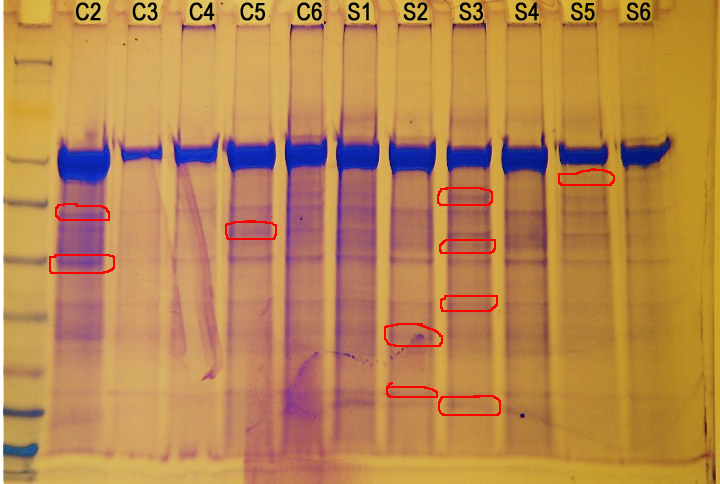 |
| PROJECTgel.jpg |
Figure 1. Protein gel results (not normalized). Circled in red are proteins of interest.
 |
| external image 20091014-f95h3a1wu32cfarp6qq559tn9k.jpg |
Conclusions/Next steps
There doesn't seem to be a correlation between protein expression and amount of stress. However, there are several different proteins being expressed in different animals.
Next week, I will attempt to finish RNA isolation and quantification and run another protein gel after filtration.
Week of Nov 30- Dec 6
RNA isolation, DNAse, RNA quantification, filtered SDS-PAGE
Summary
RNA was isolated from the tissue fixated at the beginning of the procedure. Then 20.5 uL of the sample was DNAsed. Then I attempted to quantify the RNA concentration, but there was severe contamination and I had to abandon the rest of the gene analysis. I filtered protein samples to filter out the large protein found in all the samples and ran another SDS-PAGE.
Procedure
RNA isolation
The tubes containing the tissues with Tri-Reagent from the previous lab were thawed and allowed to incubate for 5 minutes at room temperature. Then 200 μL of chloroform were added to the samples. The tubes were vortexed for 30 seconds. After allowing the tubes to incubate for 5 minutes at room temperature, the tubes were then microfuged in a refrigerator for 15 minutes at 14 rpm (max). The aqueous phase was carefully removed into a new tube. Then 500 μL of isopropanol was added to the aqueous phase tubes. The tubes were inverted well then allowed to incubate at room temperature for 10 minutes. The tubes were then microfuged in a refrigerator for 8 minutes at 14 rpm (max). The supernatant was removed and 1 mL of 75% EtOH was added to the tubes. The tubes were inverted slightly to dislodge the pellets then microfuged at 7500g for 5 minutes. Then the supernatant was removed and the pellets were allowed to dry at room temperature for 4 minutes. The pellets were then resuspended in 100 μL of 0.1% EDPC-H2O. The solution was pipetted up and down to dissolve the pellets. The tubes were incubated at 55 degrees C for 5 minutes then placed on ice and stored.
DNAse
In a 0.5 mL tube, 2.5 uL of DNAse buffer, 1 uL of Turbo DNAse, and 20.5 uL of the RNA sample were combined and then incubated for 30 minutes at 37C. Then another 1 uL of Turbo DNAse was added and the solution was again incubated for 30 minutes at 37C. then 2.5 uL of inactivation reagent was added and the tubes were mixed then allowed to incubate for 2 minutes at room temperature. The tubes were centrifuged at 10,000 rcf for 1.5 minutes. The supernatant was then transferred to new tubes.
RNA quantification
The Nanodrop was zeroed using 2 μL of 0.1% DEPC-H2O. Then 2 μL of the RNA sample was pipetted onto the Nanodrop arm and measured. After quantification, the RNA was wiped off with a Kim Wipe. After measuring 4 samples, it was realized that there were peaks presenting themselves that indicated either ethanol contamination or contamination from the DNAse procedure. Since time restrictions didn't allow for another attempt at DNAsing a sample, the gene analysis branch of lab procedure was abandoned.
Filtrated SDS-PAGE
Filtration was done using a Microcon model YM-50 to filter out proteins larger than 50 kD. 250 uL of protein sample was put into the the filter tube. 250 uL of PCR water was also added to the filter tube to increase volume. The tubes were microfuged at 14,000 g for 12 minutes. Then the filtered protein was used in the SDS-PAGE.
In screw cap tubes, 15 uL of the filtered protein sample and 15 uL of 2X Reducing buffer were combined for each sample. Then the samples were boiled for 5 minutes. The SDS-PAGE gel box was put together while the samples were boiling and the wells were rinsed thoroughly. Immediately after 5 mins of boiling, the samples were centrifuged for 1 minute to pool the liquid. Then 10 uL of a molecular ladder was added to the first well. Then 30 uL of each sample was added to each well. The lid was put on and the gel was run for 30 minutes at 150 V. After 30 min, the gel was removed from the box and added to a container containing Coomassie Stain. The gel was allowed to sit in the stain for 5 min on a shaker/rocker. Then, the stain was poured back into the original container and the gel was rinsed briefly (twice) with 10% acetic acid. Then it was immersed in acetic acid and allowed to sit for 15 minutes on the shaker/rocker. Then it was briefly rinsed again then immersed in acetic acid and allowed to sit overnight on a shaker/rocker. The next day, pictures were taken of the gel.
Conclusions/Results
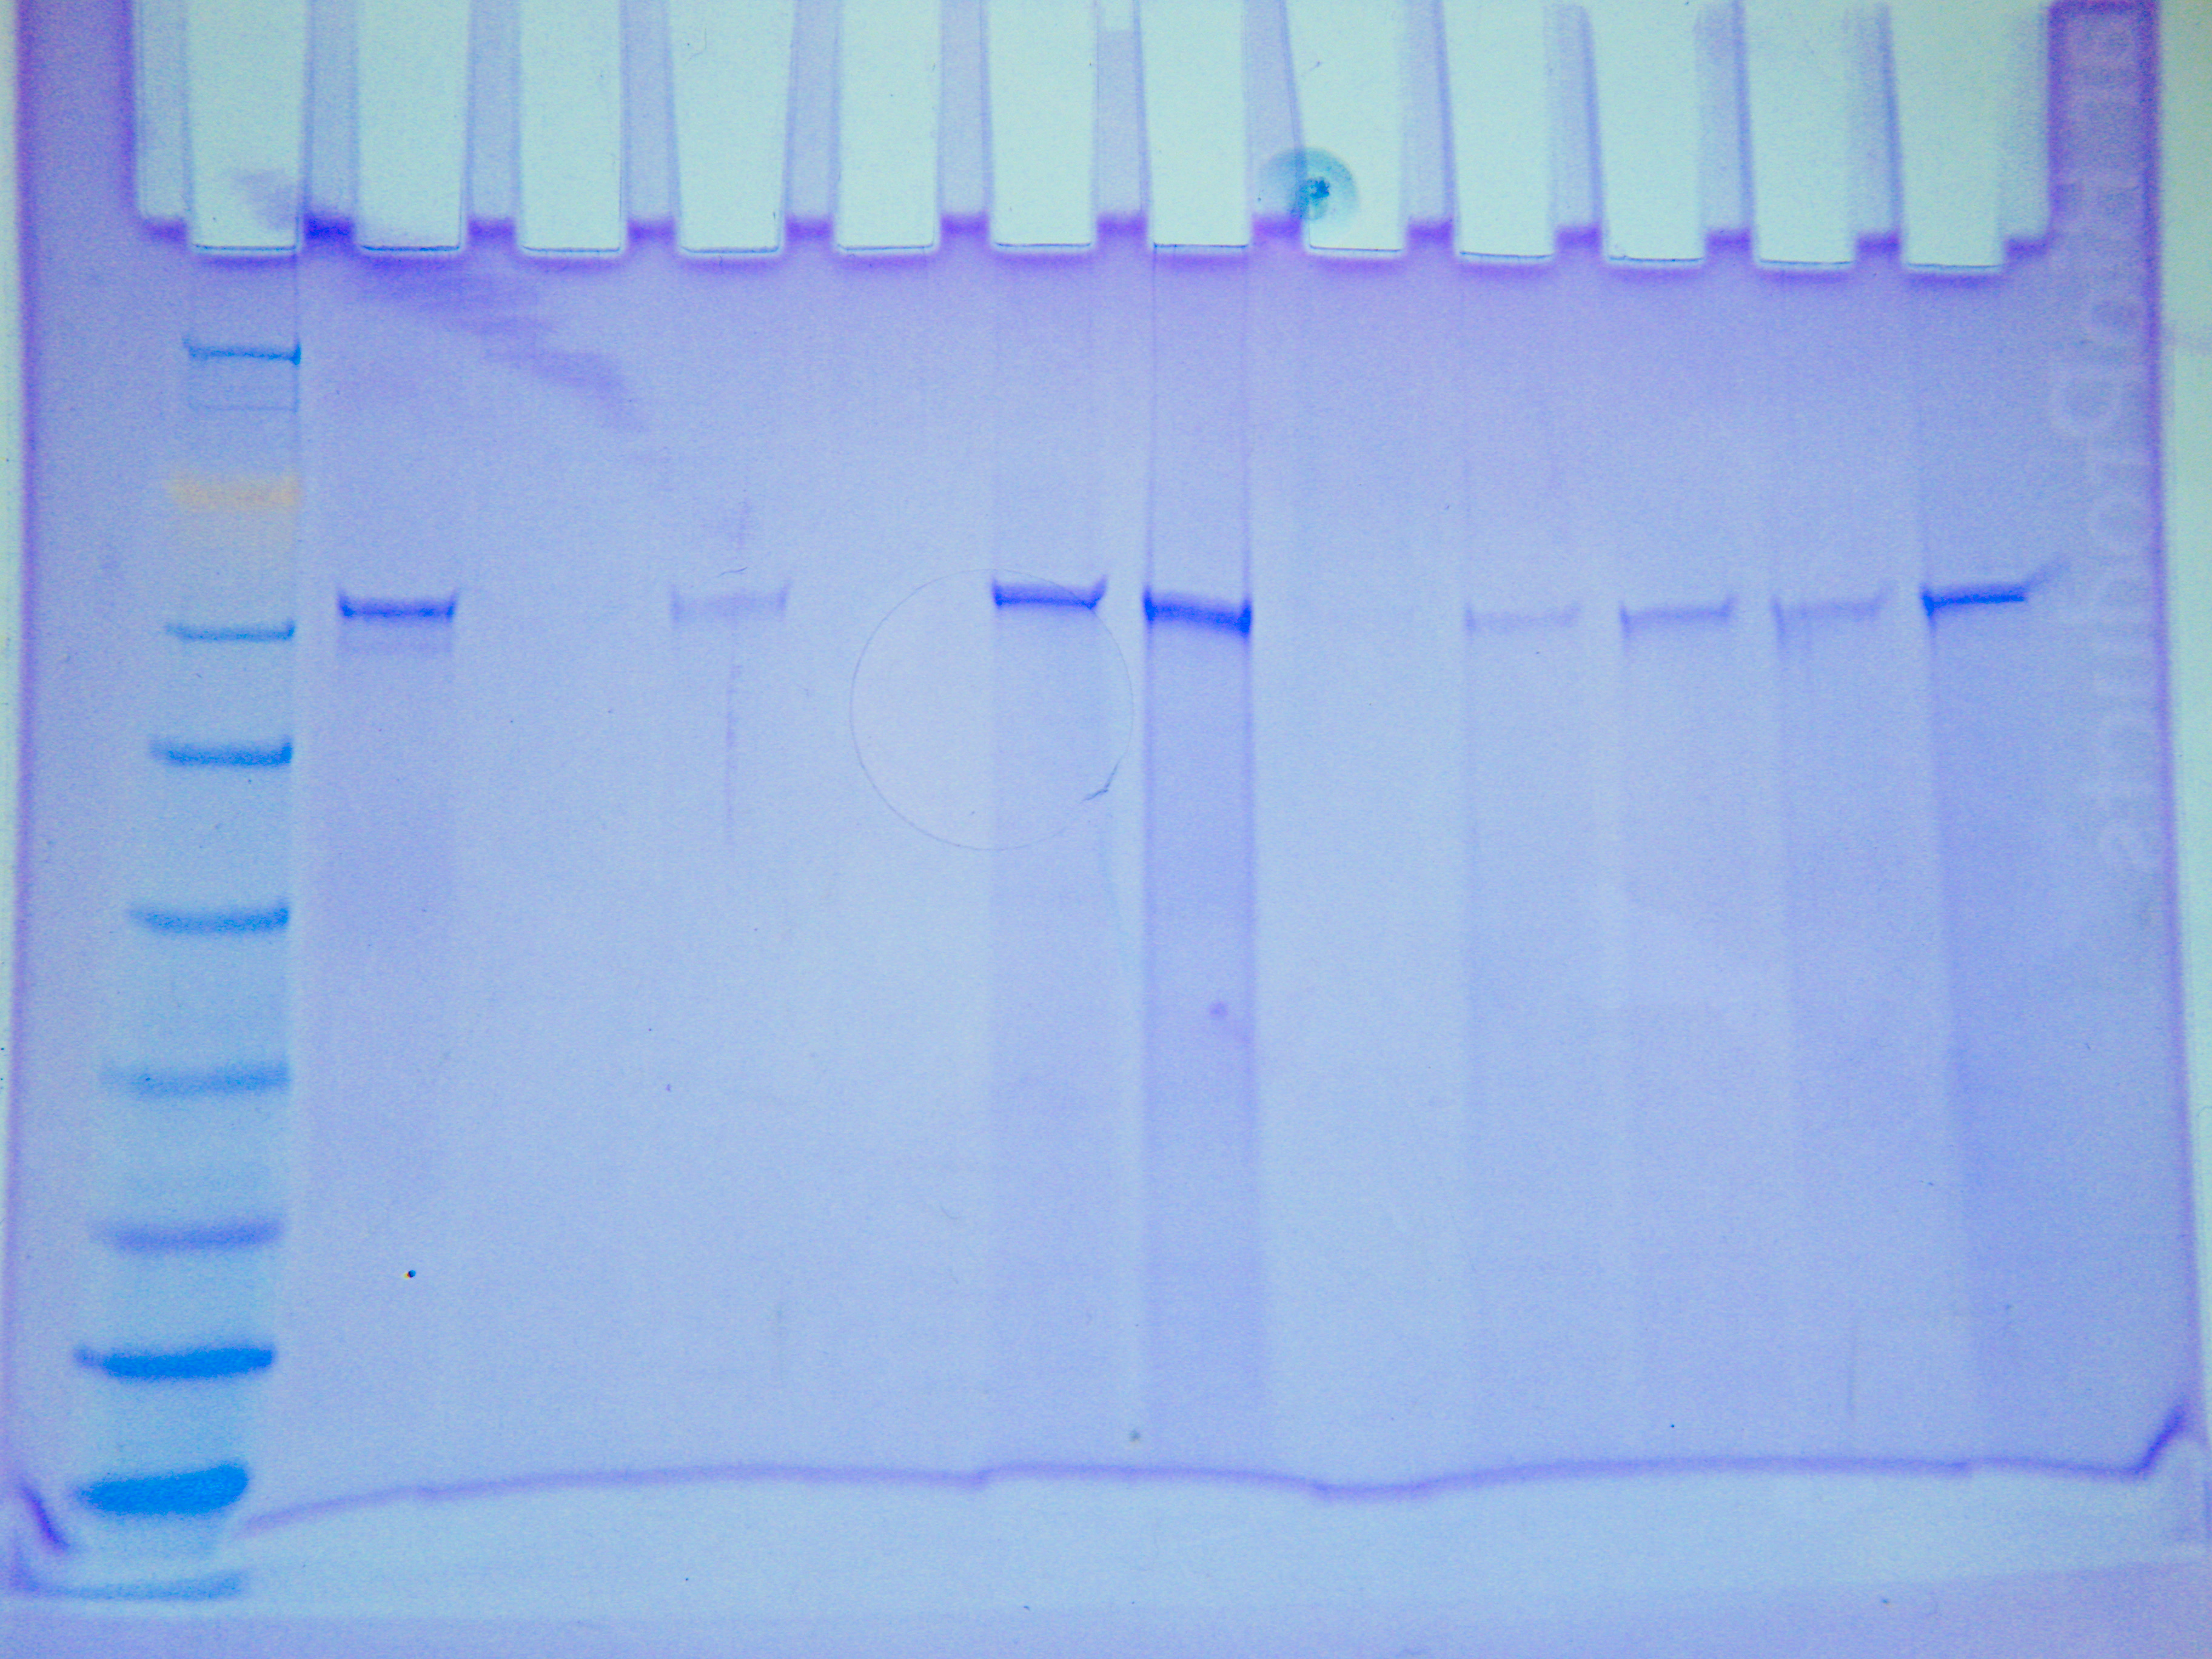
|
||
| Figure 1. Filtered protein sample SDS-PAGE gel |
The filter seemed to have filtered out some of the large protein around 62 kD, but it did not filter it all out. Additionally, it seemed to have filtered out everything smaller than 50 kD. The lack of smaller bands could also be attributed to the dilution of the sample that occurred during filtration.
Next steps
The protein sizes from the first gel will be investigated and identified using a database containing protein information about crabs.
Week of Dec 7-13
Protein analysis
Summary
Protein bands from the SDS-PAGE gel were compared to sizes in the Swiss Institute of Bioinformatics ExPASy Proteomics TagIdent tool.
(http://ca.expasy.org/tools/tagident.html) The brachyuran taxonomic ID (6752) was used to search for proteins. 11 proteins of interest were chosen to be analyzed.
| Estimated kD |
Brachyuran D |
Protein |
| 14 |
11586 - 14988 |
Cuticle protein |
| 16.5 |
14988 or 18765 |
Cuticle protein |
| 25 |
22169 or 23511 |
Superoxide dismutase or brachyurin (serine protease capable of degrading the native triple helix of collagen) |
| 30 |
Not found |
Closest was SOD and brachyuran |
| 38, 39, 43.5, 48, 50 |
40237 - 40339 |
Arginine kinase |
| 56 |
Not found |
Closest was kinases |
| 64 |
75035 |
Hemocyanin subunit 2 |
Week of Dec 21-27
Exploratory response tests: set 1
Octopus 1 - using water sample C6
Test 1 - 3 mL near octopus suckers - no response
Test 2 - 3 mL on octopus suckers - no response (negative response to the pipette)
Octopus 2 - using water sample S6
Test 1 - 3 mL near octopus suckers - no response (some change in movement but not directly indicative of a response)
Test 2 - 3 mL on octopus suckers - no response
Octopus 3 - using water sample S6
Test 1 - 3 mL near octopus suckers - possible response (some exploratory probing towards pipette)
Test 2 - 3 mL on octopus suckers - no response (some head movement)
*NOTE: octopuses had not fasted prior to tests; octopuses remained in home containers and were therefore subject to a lot of jostling and potential stress in response to researcher handling the home containers
Week of Dec 28 - Jan 3
Exploratory response tests: set 2
Octopus 1 - using water sample S6
Test 1 - 3 mL near octopus suckers - no response
Test 2 - 3 mL on octopus suckers - no response
Octopus 2 - using water sample C6
Test 1 - 3 mL near octopus suckers - no response
Test 2 - 3 mL on octopus suckers - no response (aversion to pipette)
Octopus 3 - using water sample S6
Test 1 - 3 mL near octopus suckers - no response
Test 2 - 3 mL on octopus suckers - no response (some color change but not clearly indicative of response)
*NOTE: octopuses had fasted prior to tests; octopuses more tolerant of pipette during 2nd trial set
1/28/10
Lab work: Reverse transcription and PCR
Using 10 samples (C1, C2, C3, C4, C5, S2, S3, S4, S5, S6) of unstandardized RNA from gill samples. Primer: Na/Cl/K. Expected product size: 495 bp.
1. Transfer 5 uL of RNA to 0.5 mL PCR tubes.
2. Incubate tube at 75C for 5mins in thermal cycler.
3. Transfer tube IMMEDIATELY to ice and incubate for at least 5mins.
4. Make Master Mix (MM) for 11 reactions:
PER RXN
4 ul 5x Buffer (AMV RT Buffer)
8 ul dNTPs (10 mM total)
1 ul AMV RTranscriptase
1 ul Oligo dT Primer
1 ul RNase free water
Total = 15 ul
- Add MM to tube with diluted RNA in it (total volume now 20 ul)
- Vortex
- Spot spin
- Incubate at RT for 10 min
- Incubate at 42C for 1 hr in thermocycler
- Heat inactivate @ 95C for 6 min
- Spot spin
PCR
Prepare for 13 reactions (10 samples, 2 negative controls, 1 extra) using 0.5 mL PCR tubes:
For a 50μl reaction volume:
| Component |
Volume |
|
| TaqRed Master Mix, 2X |
25 uL |
|
| upstream primer, 10μM |
2.0 μl |
|
| downstream primer, 10μM |
2.0 μl |
|
| Ultra Pure water |
19 uL |
Run thermocycler.
NOTE: used reconstituted primer instead of 10 uM primer.
2/1/10
PCR gel run
Ran PCR gel. Final product a bust because I used the wrong primer (excessive primer dimer).
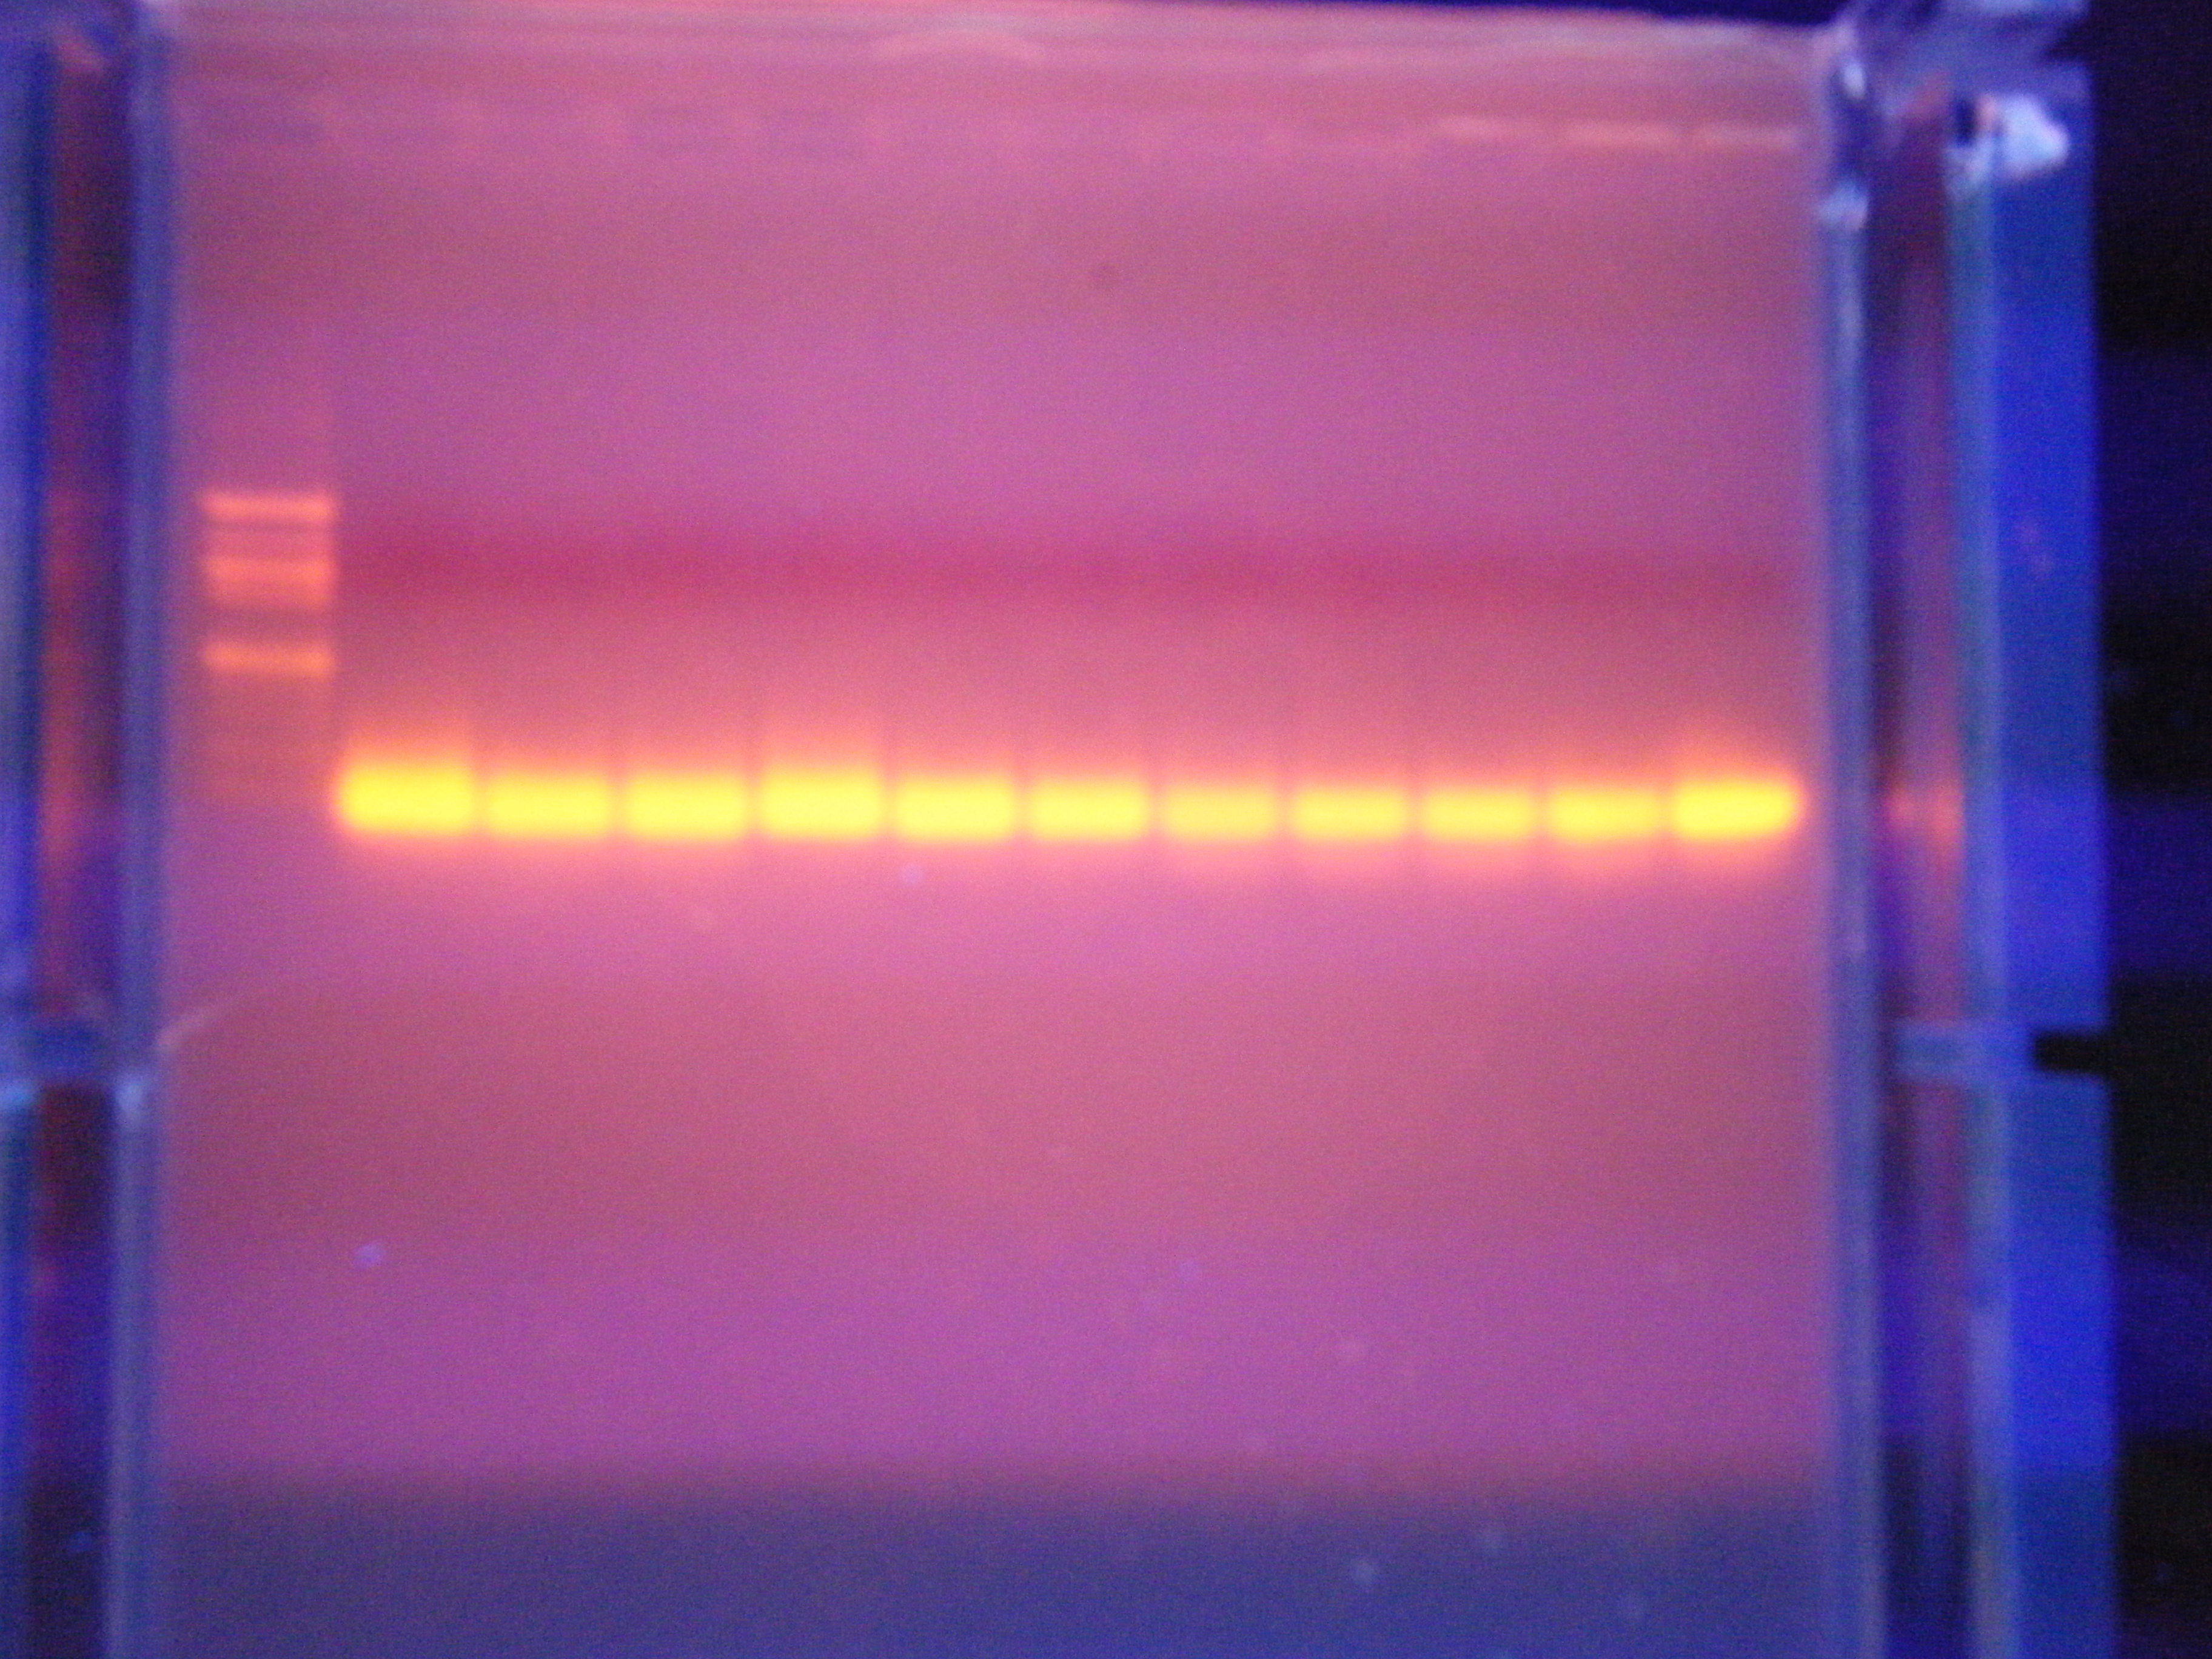
Wells (L-R): ladder, C1, C2, C3, C4, C5, S2, S3, S4, S5, S6, negative control
2/4/10
PCR
Used cDNA and 10 uM Na/K/Cl primer and remade master mix. Ran thermocycler.
Denature @ 94, Annealing @ 55C, Extension @ 72C
For a 50μl reaction volume:
| Component |
Volume |
|
| TaqRed Master Mix, 2X |
25 uL |
|
| upstream primer, 10μM |
2.0 μl |
|
| downstream primer, 10μM |
2.0 μl |
|
| Ultra Pure water |
19 uL |
2/5/10
PCR gel
Ran PCR gel at 110 V for 45 mins.
Denature @ 94, Annealing @ 55C, Extension @ 72C
Gel recipe:
150 mL of 1x TAE
1.5g of agarose
12 uL of ethidium bromide
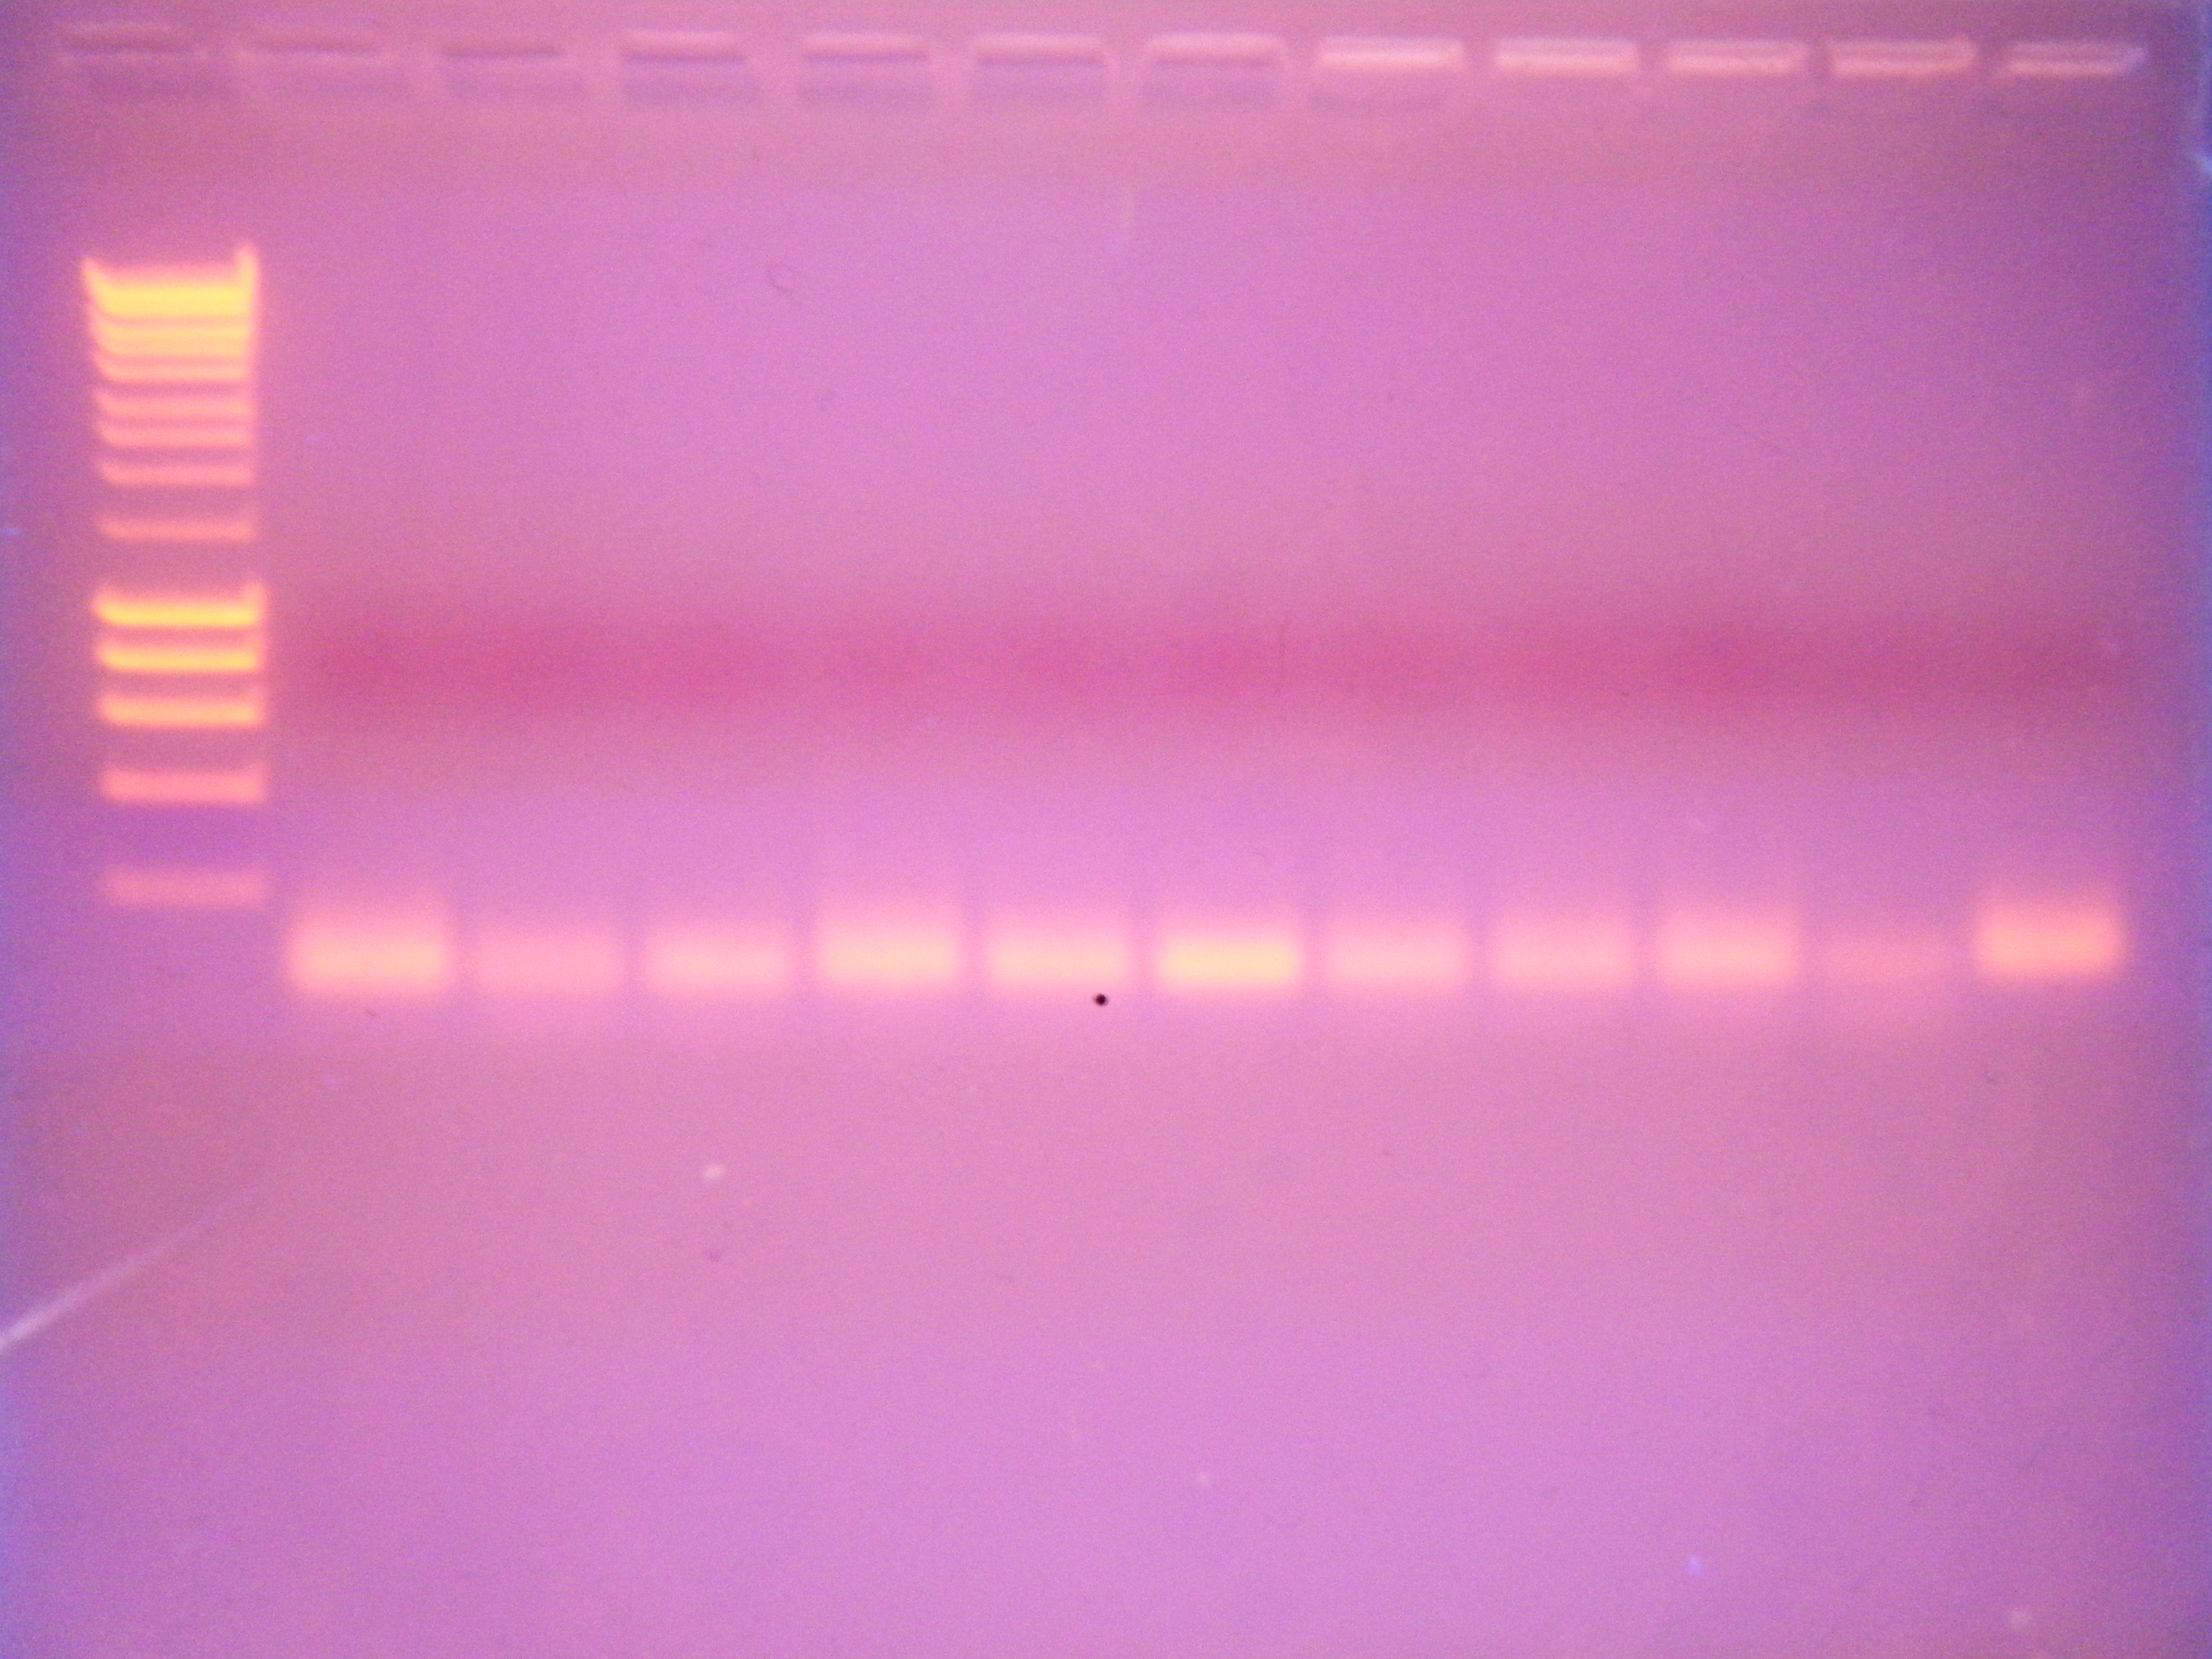
Gel wells: ladder (100 well Superladder), C1, C2, C3, C4, C5, S2, S3, S4, S5, S6, negative control
2/11/10
PCR test prep and protein filtration prep
PCR:
- pooled all cDNA samples (C1-C5, S2-S6): 4 uL of each sample
- Prepped for PCR using 5 primers: Mt, CHH, CHH6, Na/K/Cl, and general euk primer
- Ran 10 samples, 2 per primer (one test, one negative control)
- PCR cycle: Denature @ 94C, Annealing @ 50C, Extension @ 72C
For a 50μl reaction volume:
| Component |
Volume |
|
| TaqRed Master Mix, 2X |
25 uL |
|
| upstream primer, 10μM |
2.0 μl |
|
| downstream primer, 10μM |
2.0 μl |
|
| Ultra Pure water |
19 uL |
-Made two 1.3 aliquots of each sample (S1-S5, C1-C5) (20 samples total)
-Put in freeze-dryer overnight
2/12/10
PCR and Protein gel
PCR
-Ran @ 105 V for 45 min
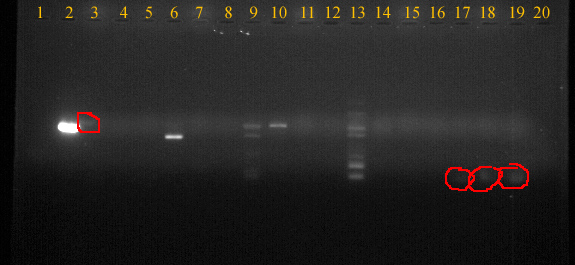
UV picture of gel.
Well order:
| Well |
3 |
5 |
7 |
9 |
11 |
13 |
15 |
17 |
18 |
19 |
| Sample |
Euk primer |
Euk -control |
CHH |
CHH -control |
CHH6 |
CHH6 -control |
Mt |
Mt -control |
Na/K |
Na/K -control |
Protein gel
-diluted freeze-dried samples in 100 uL of TE buffer (pH = 8.5)
-spun 10 samples (one from each orignal sample) and removed supernatant
-added 100 uL of protein gel loading dye to samples, then boiled for 5 min
-loaded gel, ran @ 150 V for 45 min
-soaked in Coomassie stain for 5 min on shaker/rocker
-rinsed twice in acetic acid then left soaking in acetic acid on shaker/rocker over weekend
2/16/10
Protein gel results and PCR
-protein gel showed no results
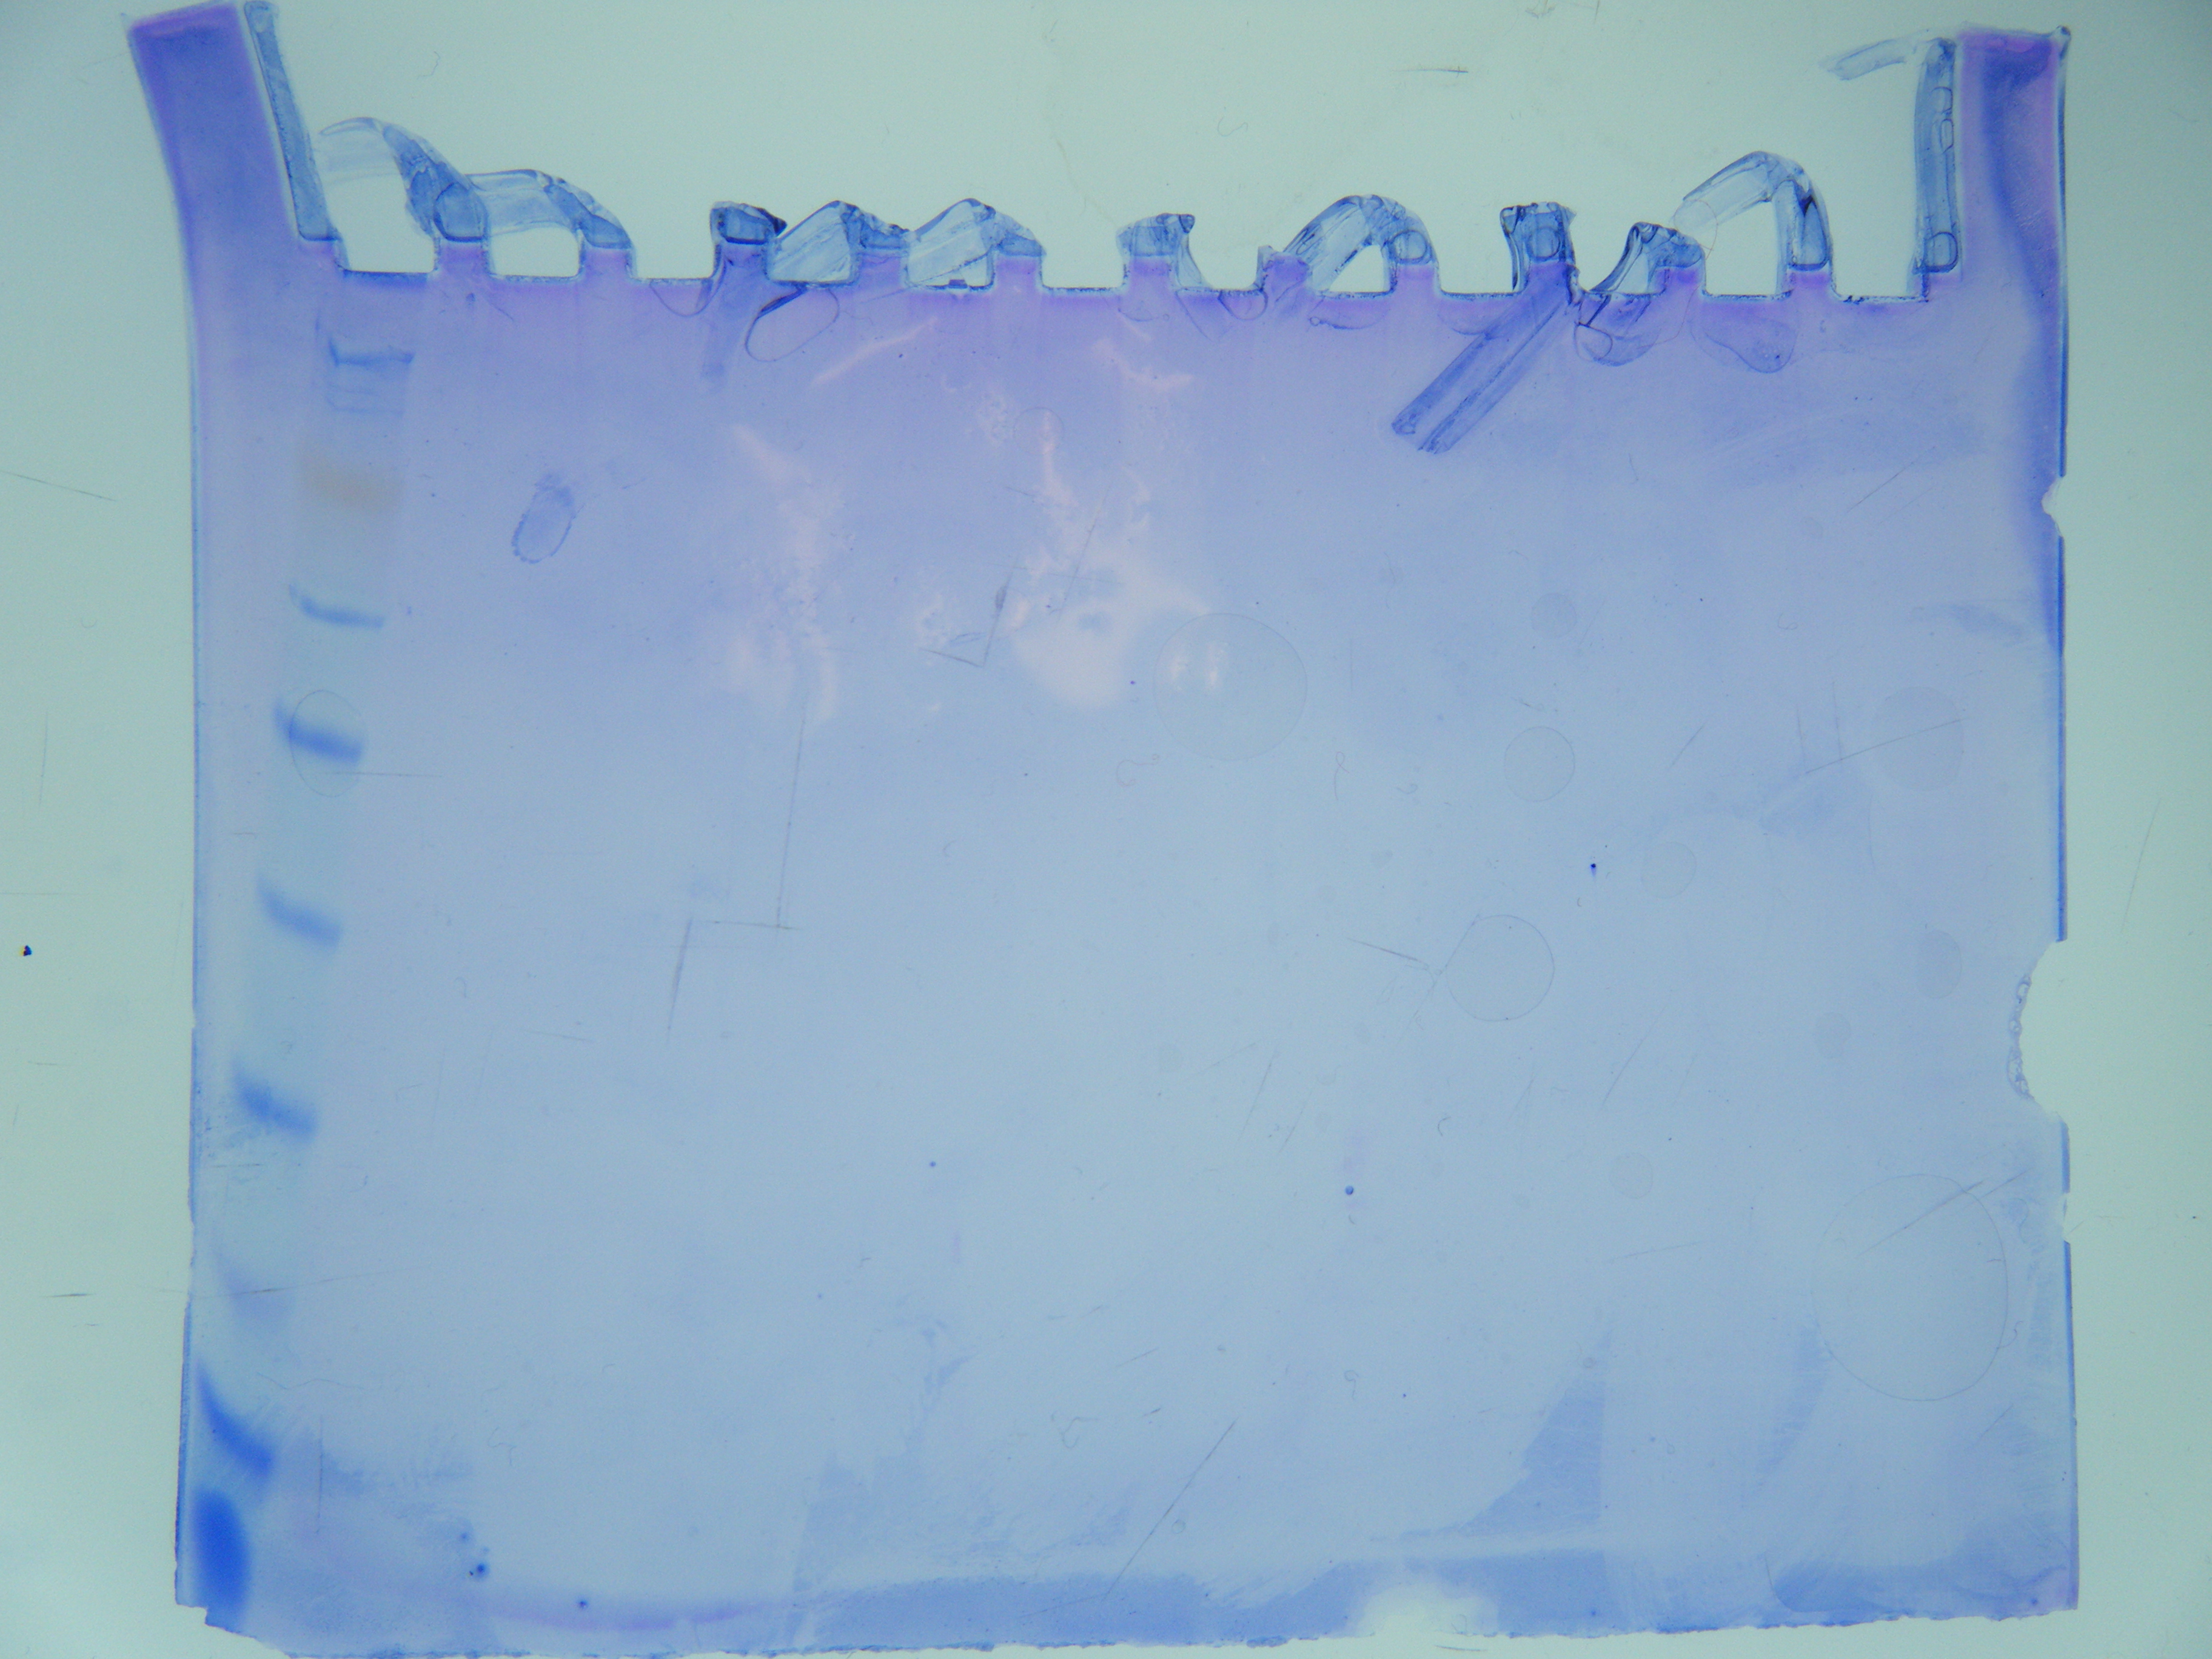
Protein gel
-looking into testing water samples for ammonia, nitrates etc using aquarium testing supplies
PCR pooled DNA test 2
- Prepped for PCR using 5 primers: Mt, CHH, CHH6, Na/K/Cl, and general euk primer
- Ran 10 samples, 2 per primer (one test, one negative control)
- PCR cycle: Denature @ 94C, Annealing @ 50C, Extension @ 72C
2/18/10
PCR pooled DNA test 2 gel
-prepped PCR gel: 150 mL TAE, 1.5 g agarose, 12 uL ethidium bromide
-ran gel @ 108V for 50 min
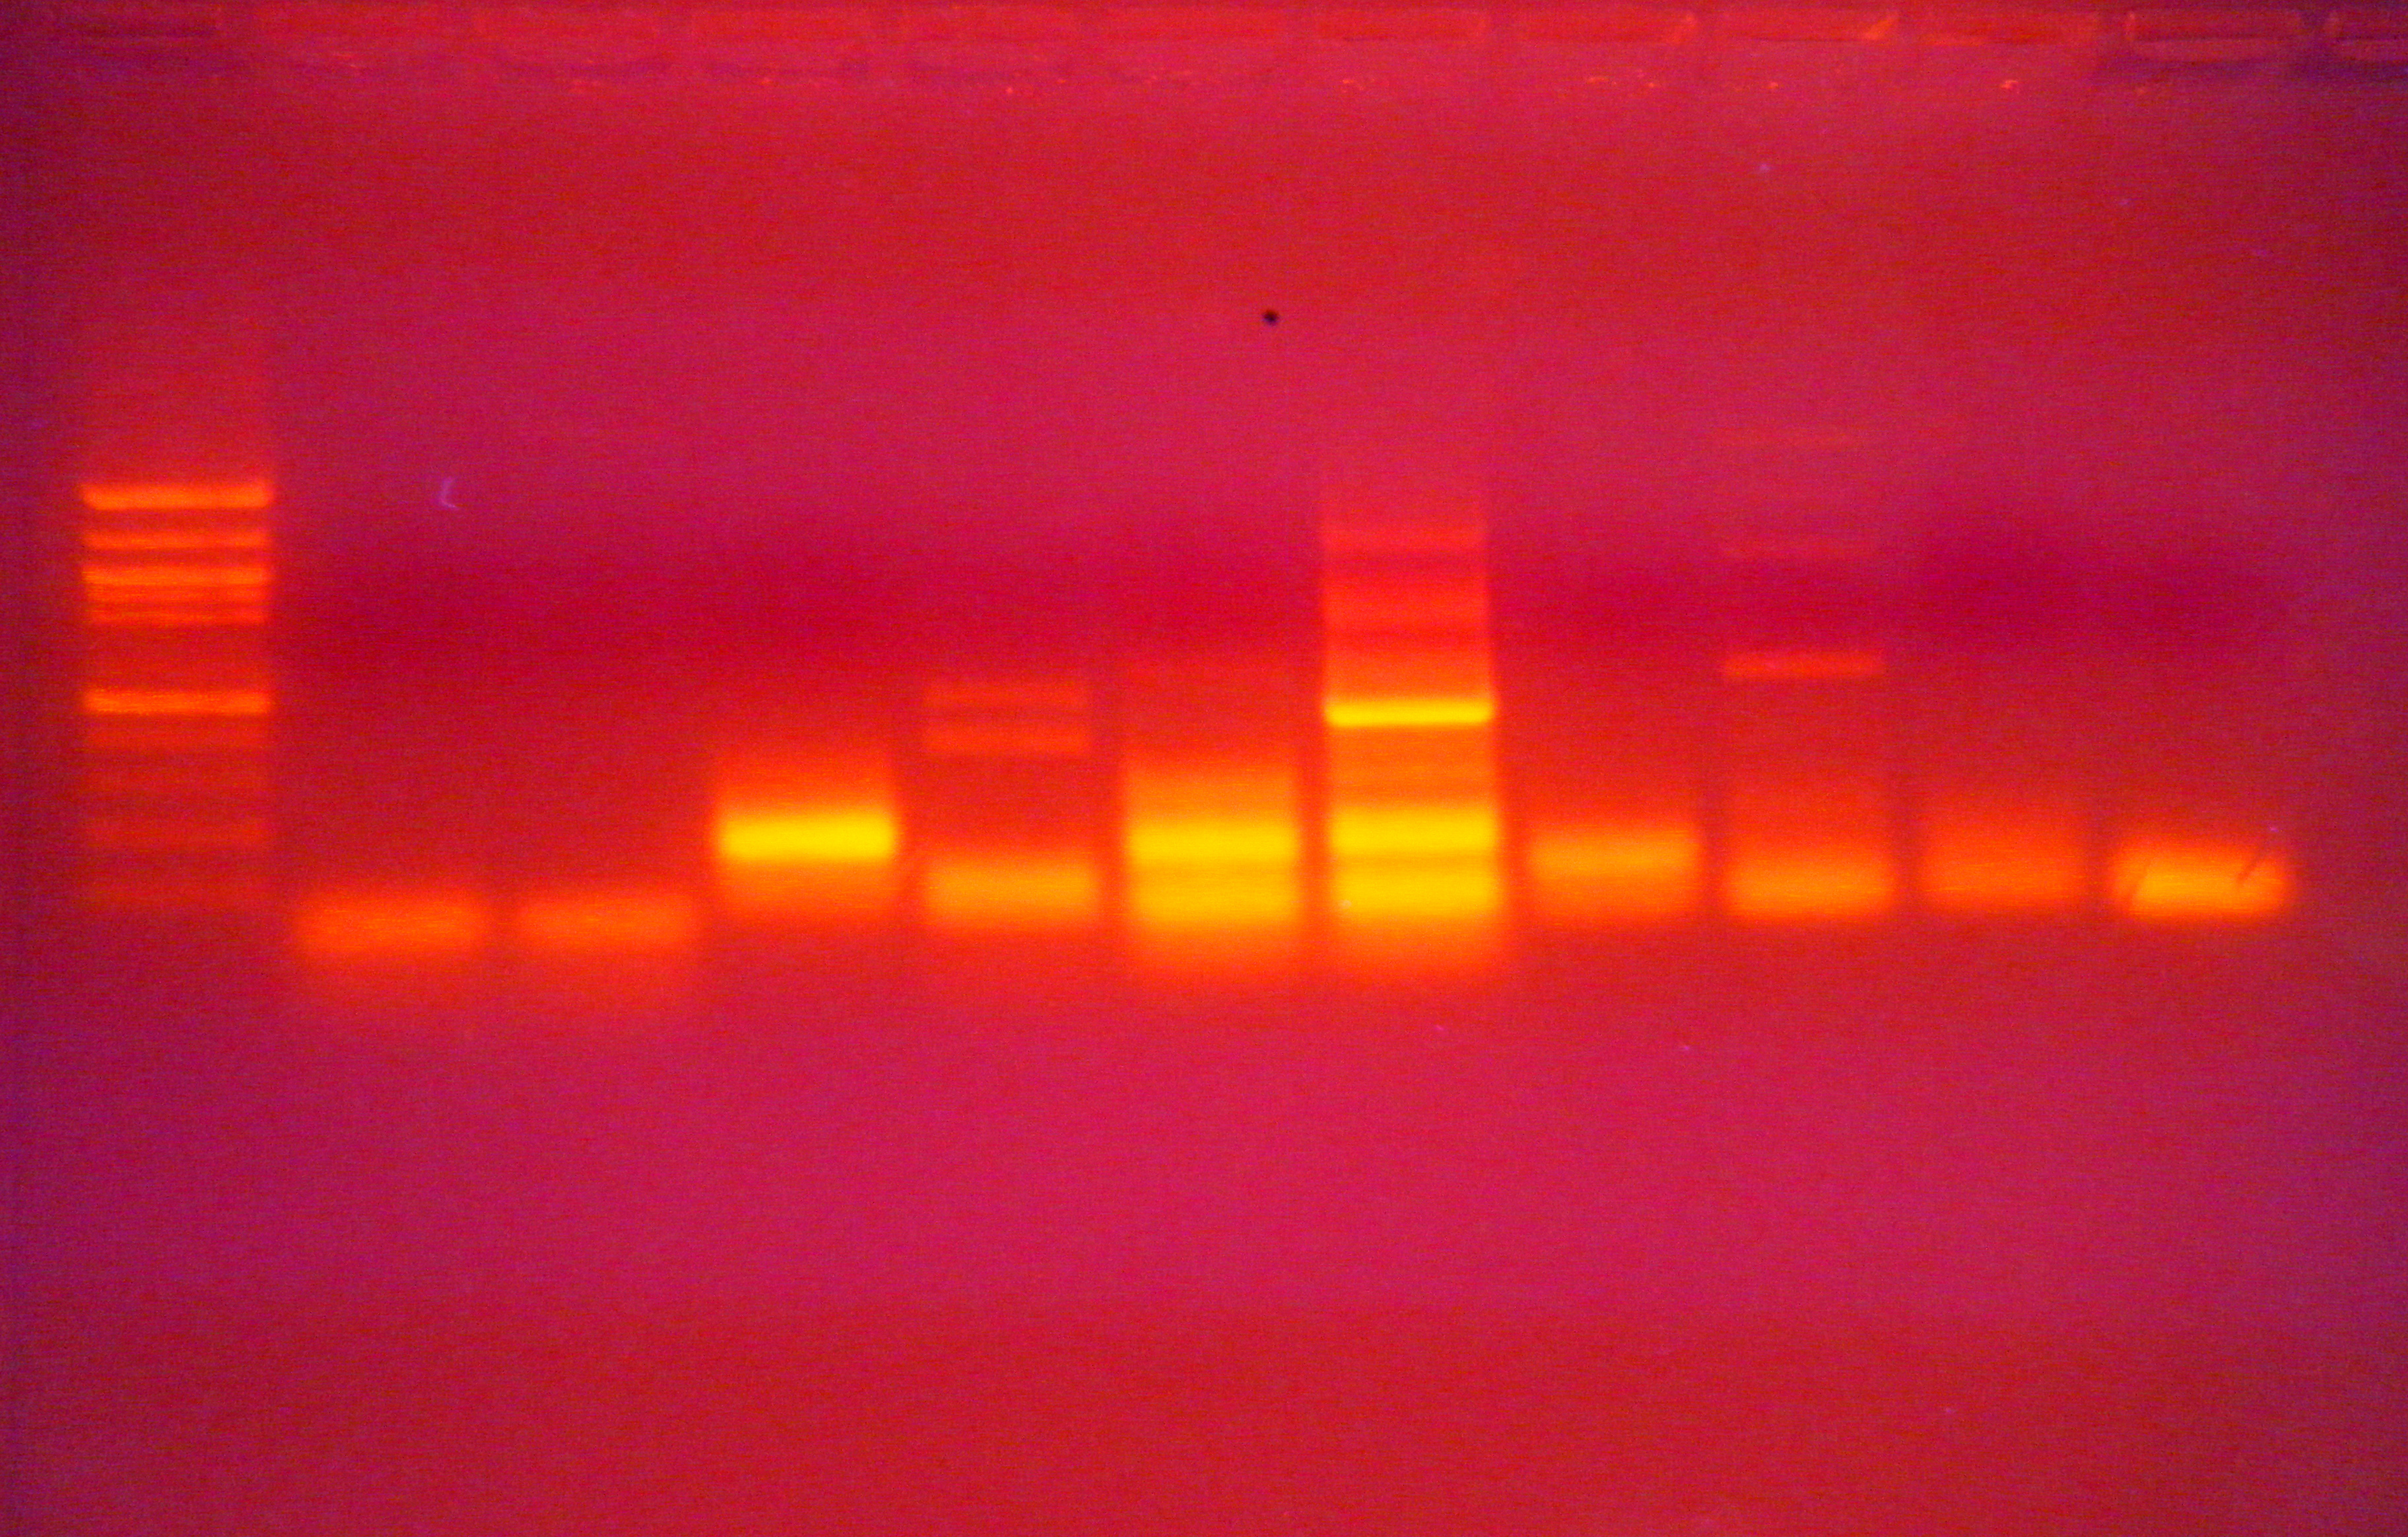
Well order:
| Well |
1 |
2 |
3 |
4 |
5 |
6 |
7 |
8 |
9 |
10 |
| Sample |
Euk primer |
Euk -control |
CHH |
CHH -control |
CHH6 |
CHH6 -control |
Mt |
Mt -control |
Na/K |
Na/K -control |
CHH - 435
CHH6 - 242
Mt - 495
Na/K/Cl- 285
-CHH and Na/K primers seemed to work
-too much contamination in CHH6
-Mt seems to have a product that is too small
-no euk primer fragment?
2/22/10
PCR
- Prepped for PCR using CHH primer
- Ran 11 samples: C1, C2, C3, C4, C5, S2, S3, S4, S5, S6, negative control
- PCR cycle: Denature @ 94C, Annealing @ 50C, Extension @ 72C
2/25/10
PCR
- prepped PCR gel: 150 mL TAE, 1.5 g agarose, 12 uL ethidium bromide
- ran at 108V for 40 min
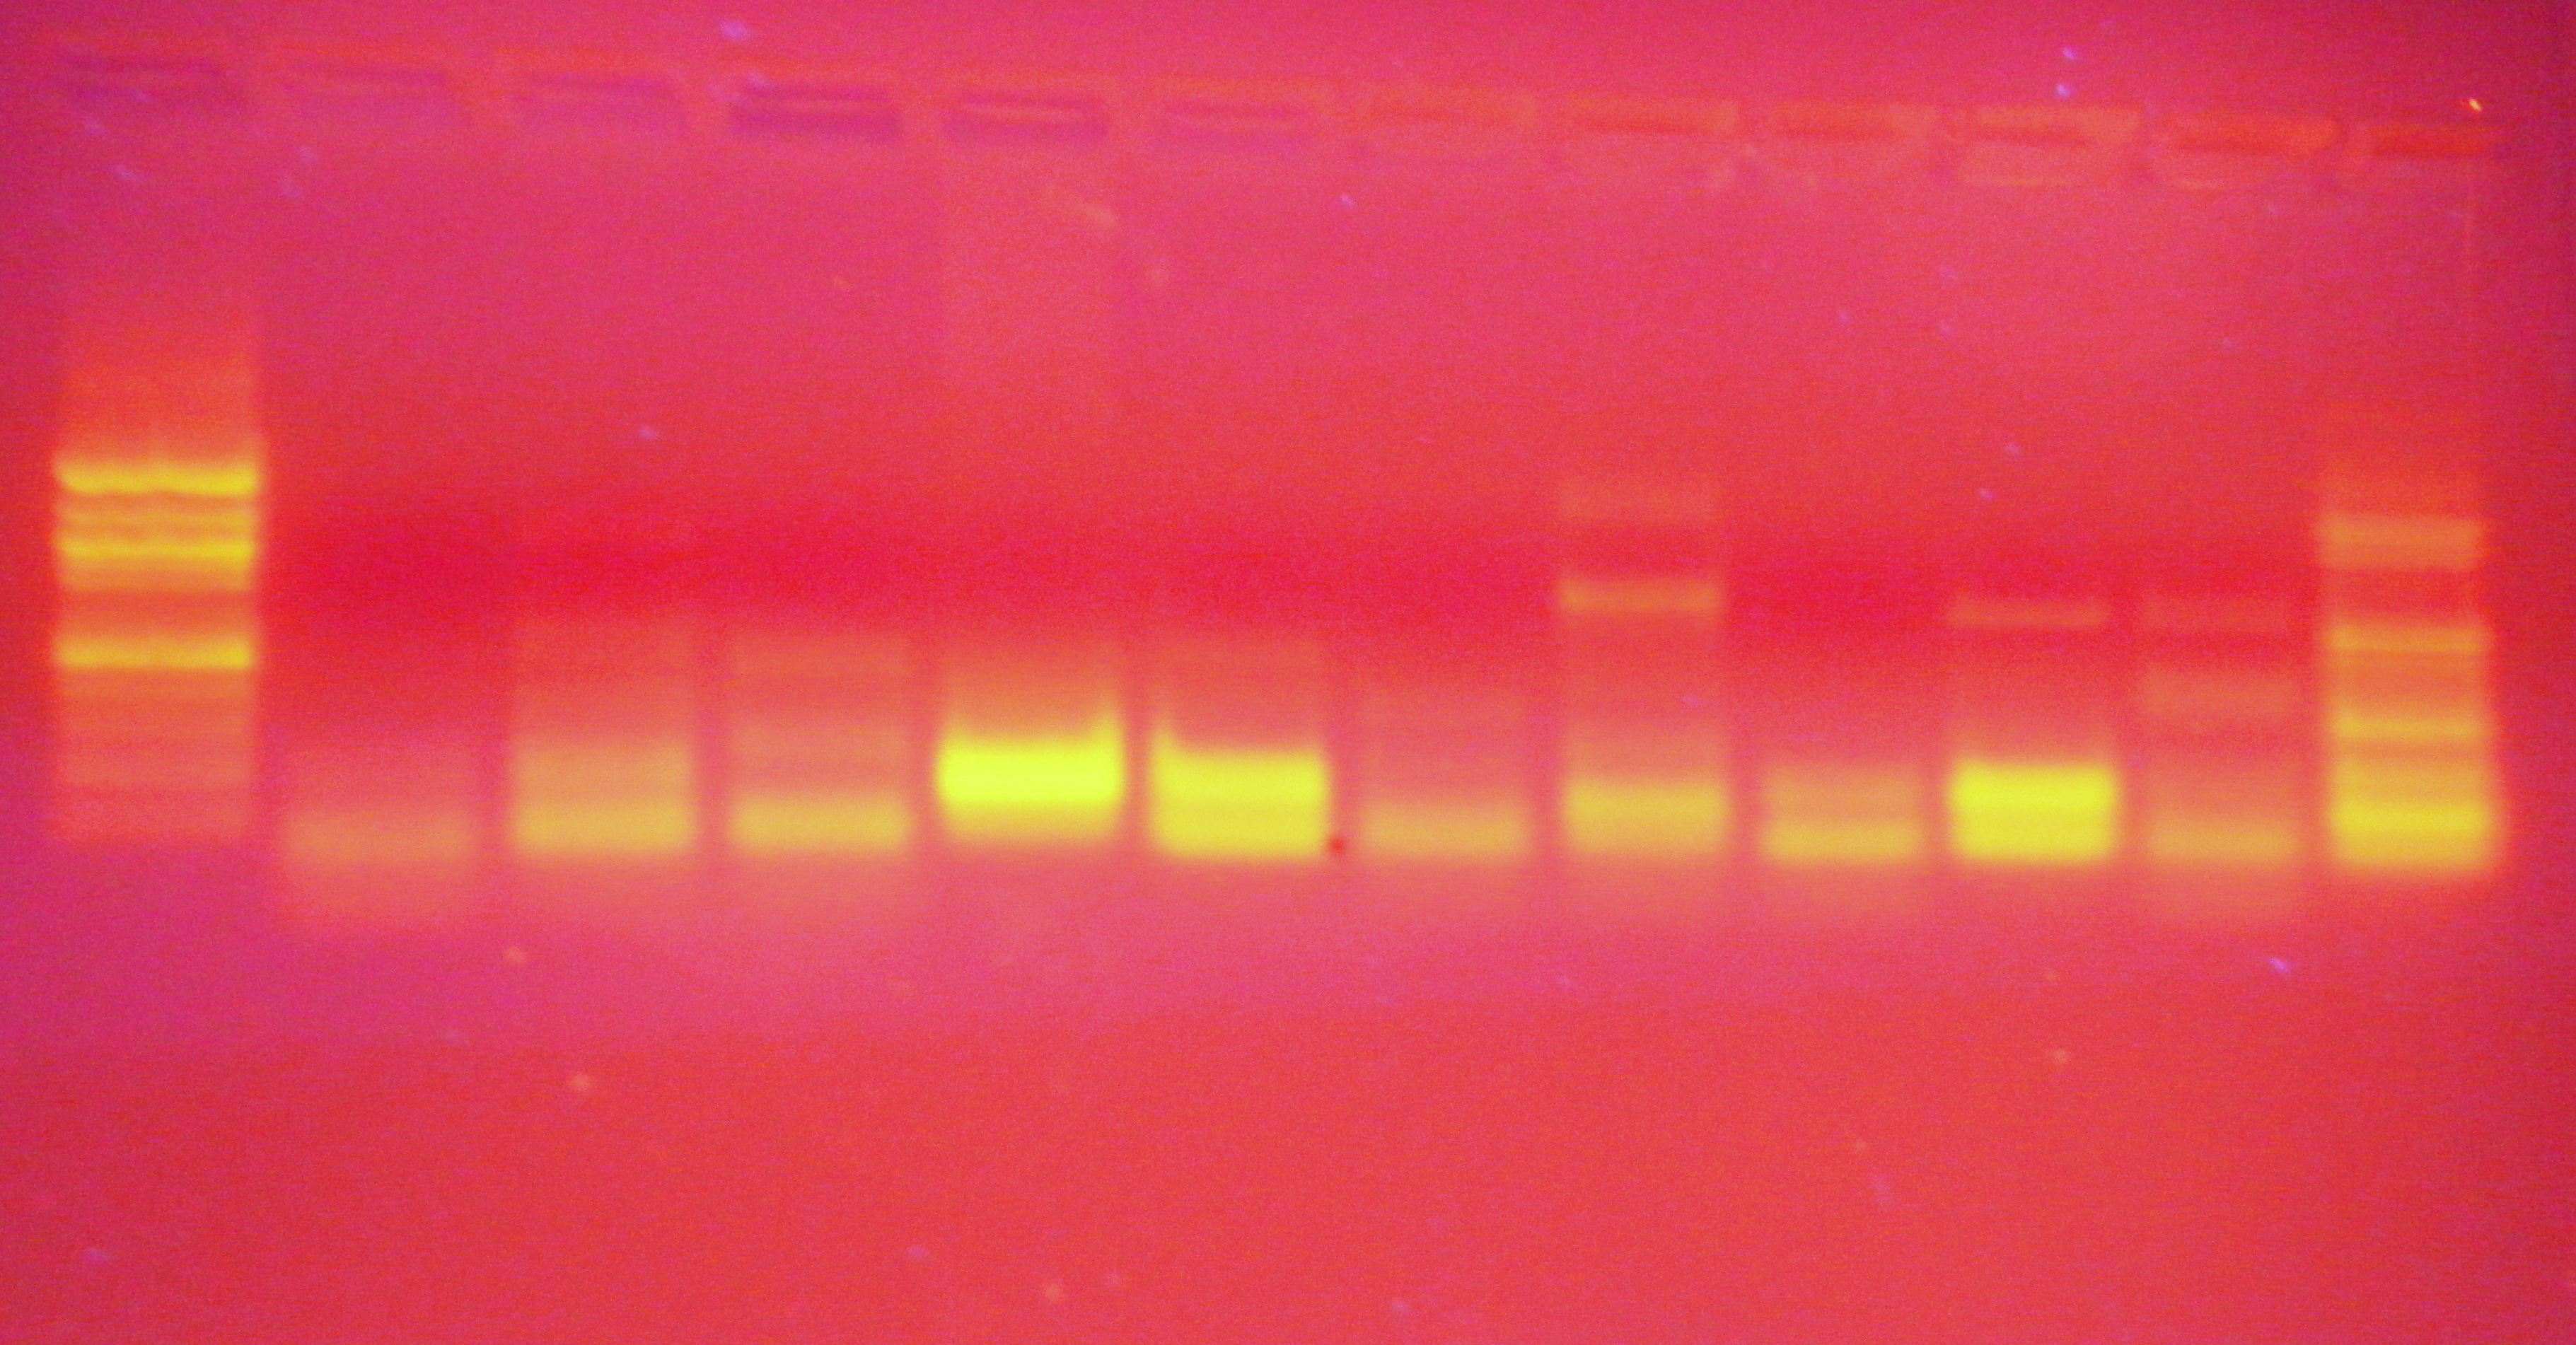
||
| Well |
1 |
2 |
3 |
4 |
5 |
6 |
7 |
8 |
9 |
10 |
11 |
| Sample |
C1 |
C2 |
C3 |
C4 |
C5 |
S2 |
S3 |
S4 |
S5 |
S6 |
- control |
Expected fragment size: 435
Primer length: 20
- I have no idea why the negative control has so many bands
- I also have no idea why there are multiple bands in almost all the others
2/26/10
Water sample testing day 1
- tested pH and began testing ammonia
data table coming
3/1/10
PCR and water sample testing
PCR
- Prepped for PCR using CHH primer
- Ran 12 samples: C1, C2, C3, C4, C5, S2, S3, S4, S5, S6, 2 negative controls
- PCR cycle: Denature @ 94C, Annealing @ 55C, Extension @ 72C
Water sample testing day 2
- finished testing ammonia and nitrite
data table coming
3/4/10
PCR gel and water sample testing
PCR
- prepped PCR gel: 150 mL TAE, 1.5 g agarose, 12 uL ethidium bromide
- ran at 108V for 40 min
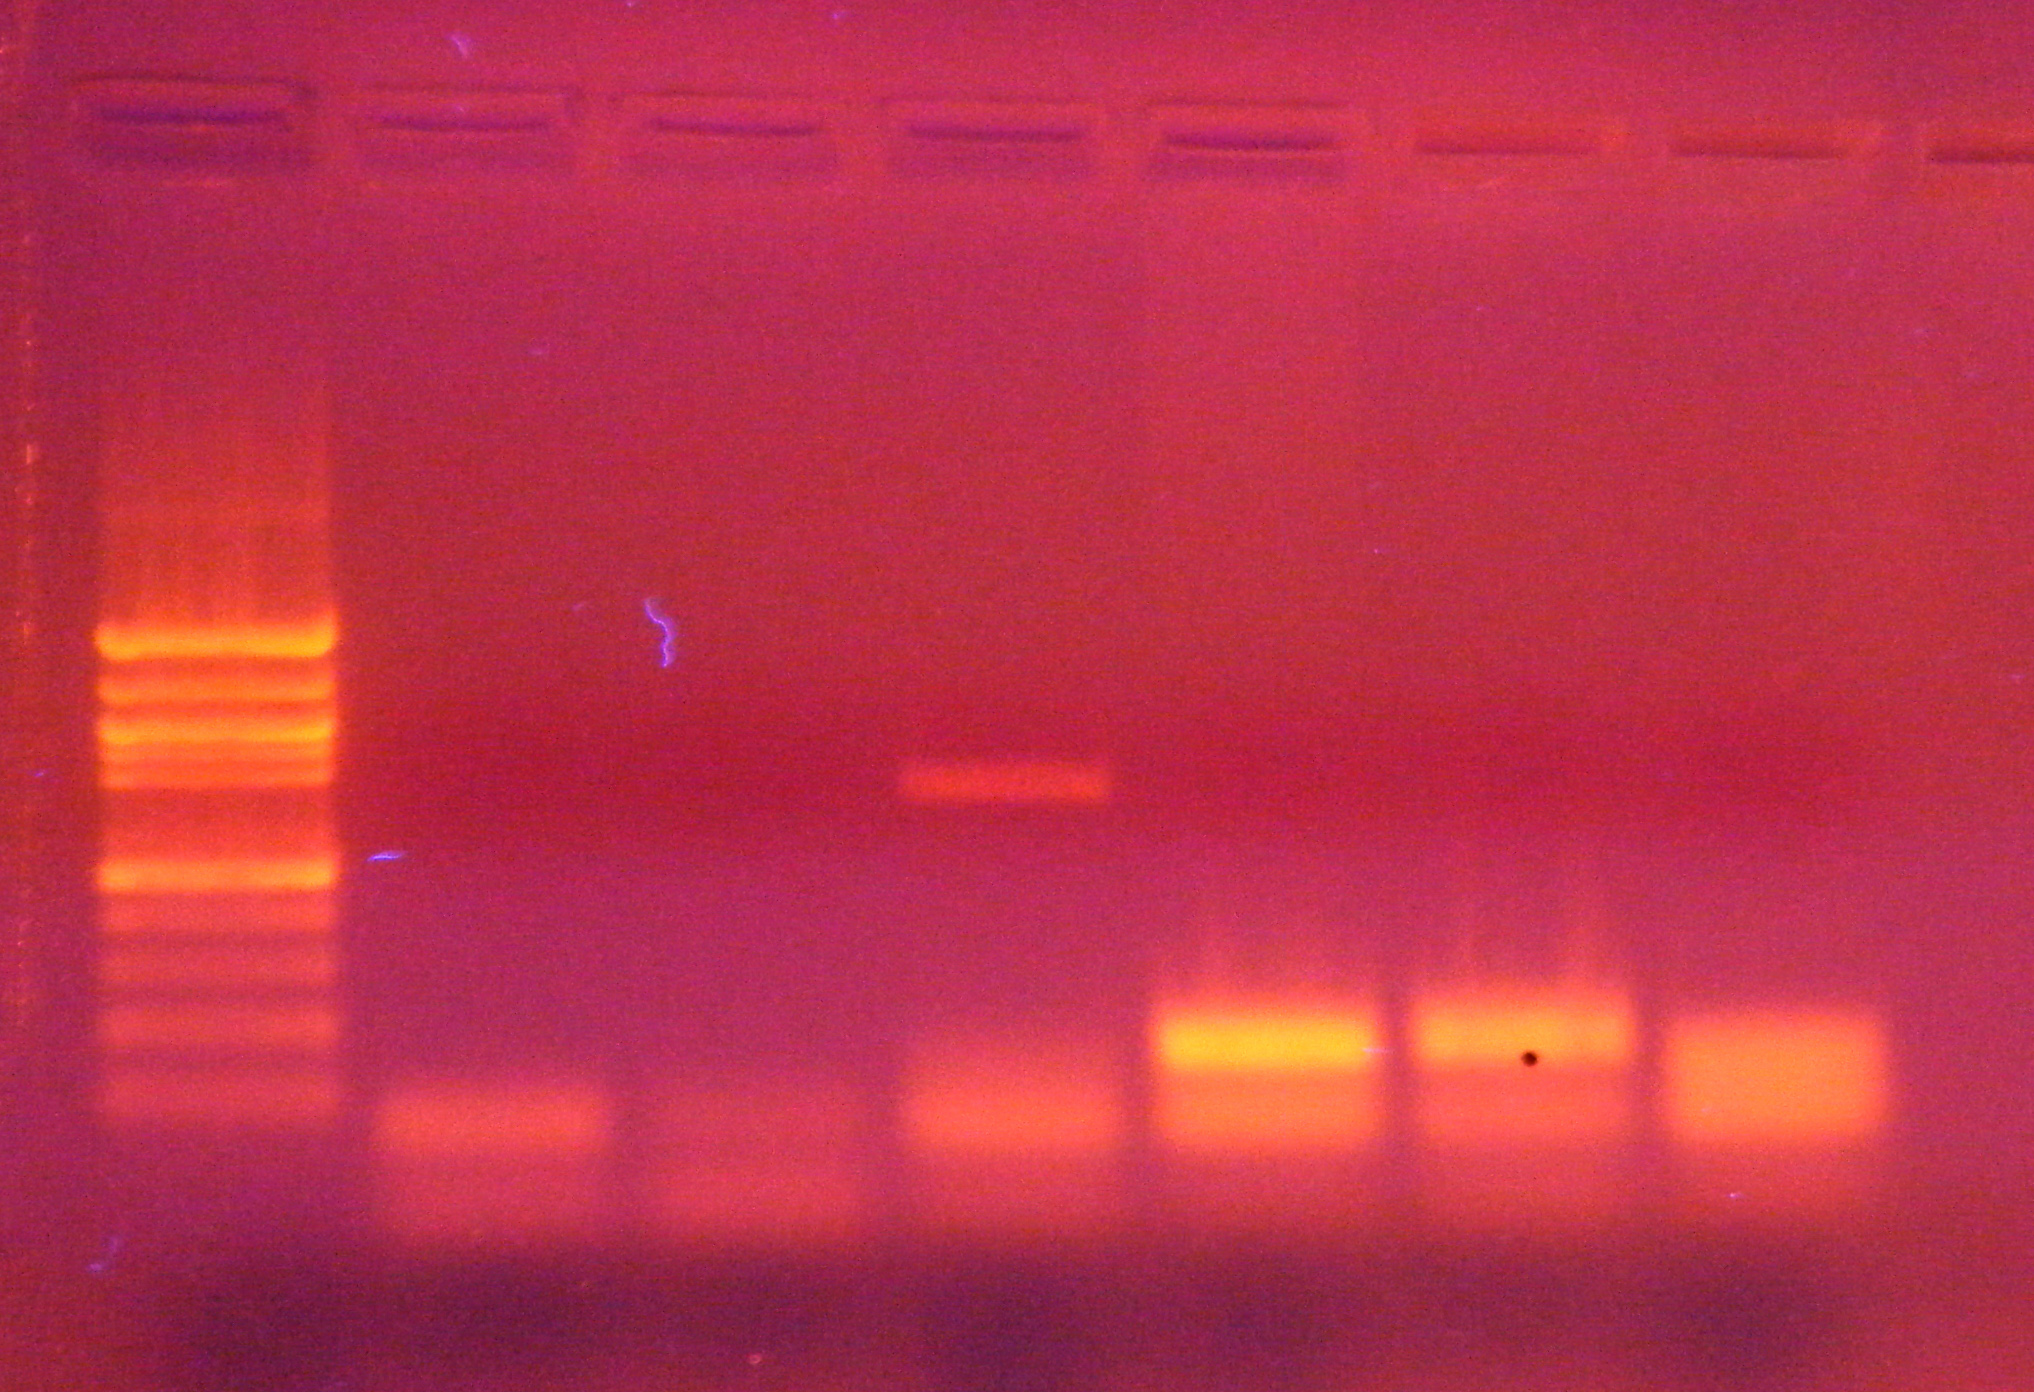
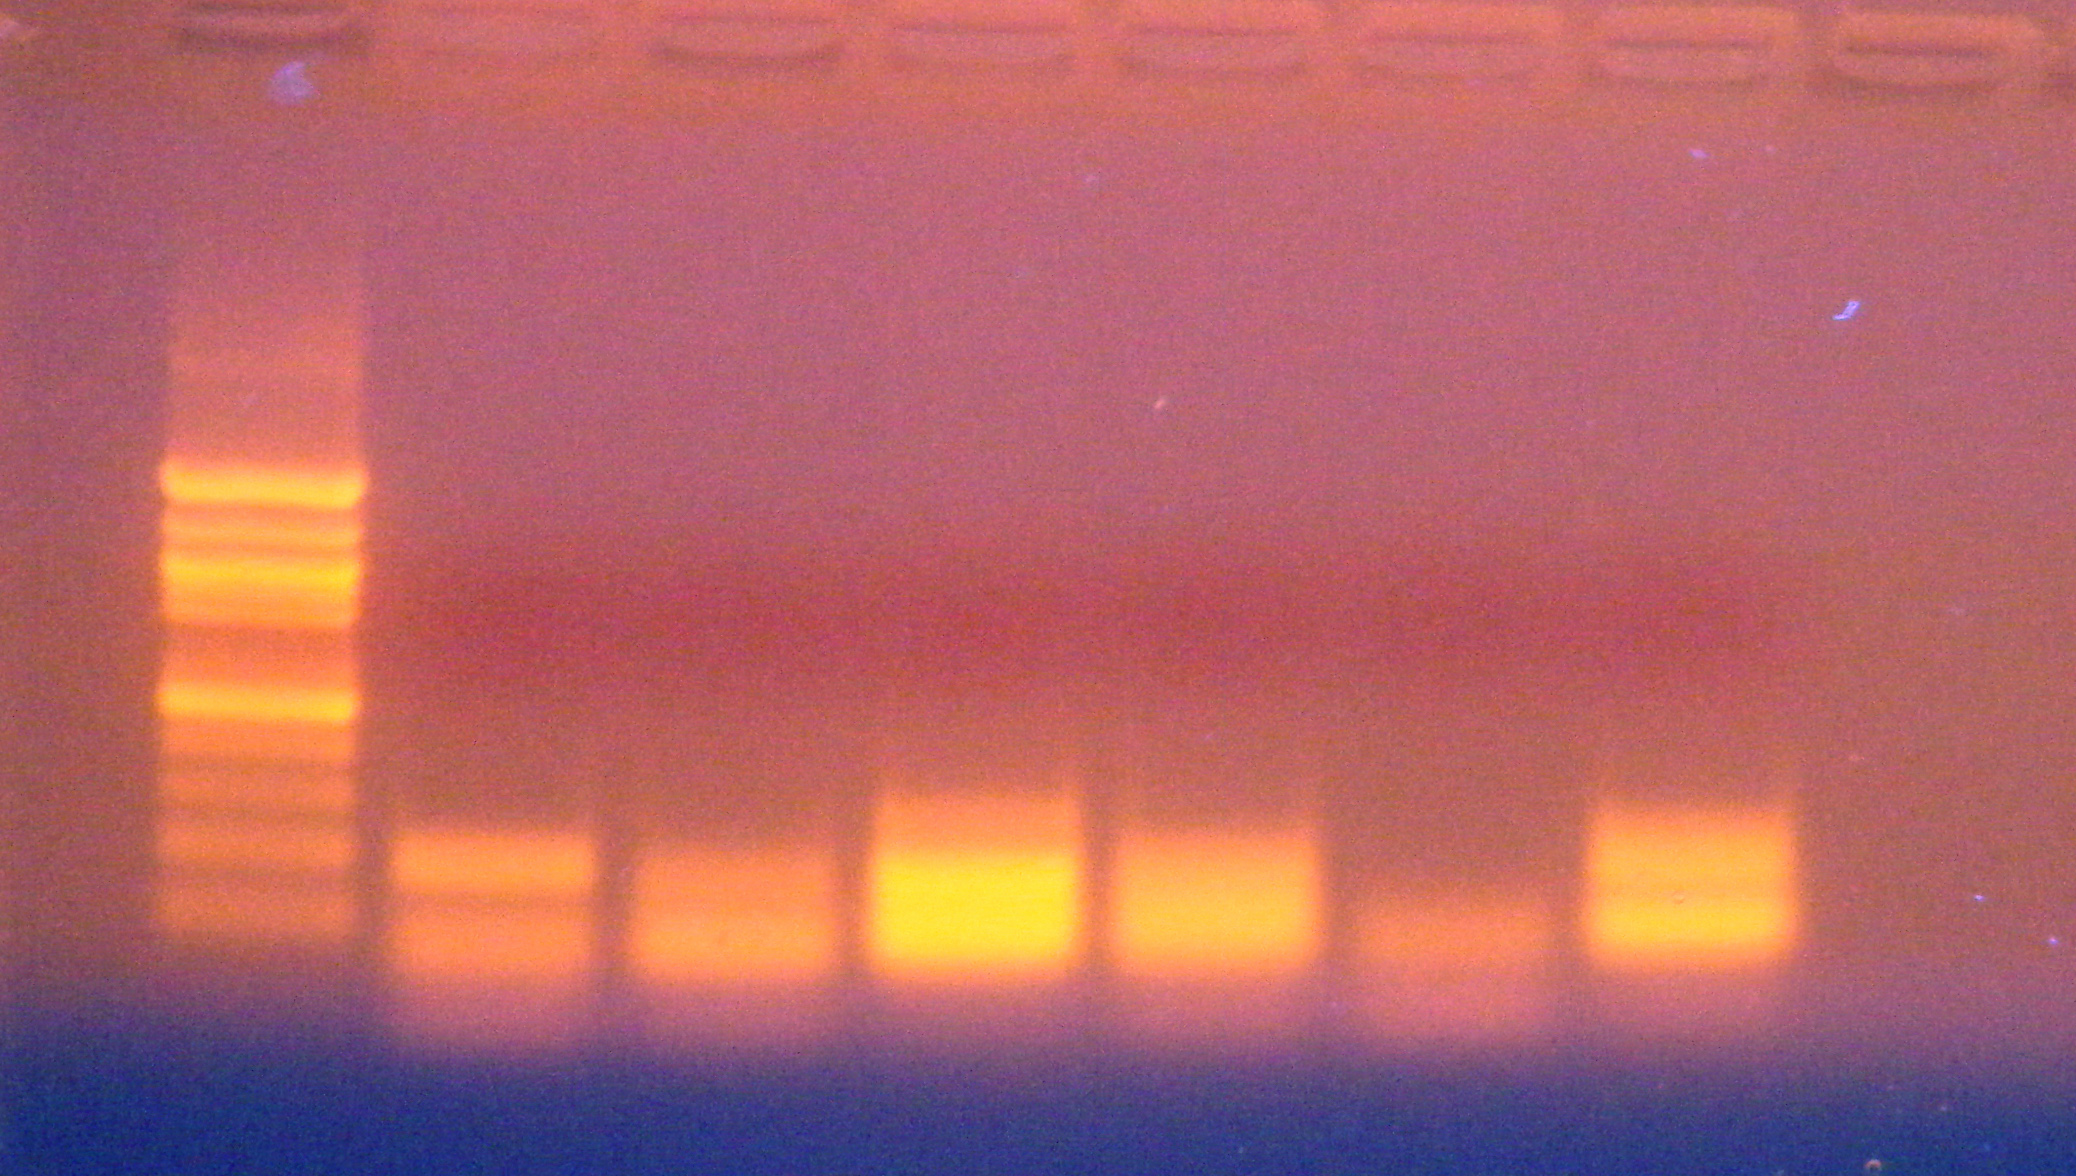
| Well |
1 |
2 |
3 |
4 |
5 |
6 |
| Sample row 1 |
C1 |
C2 |
C3 |
C4 |
C5 |
- control |
| Sample row 2 |
S2 |
S3 |
S4 |
S5 |
S6 |
- control |
- tested water sample for nitrate
| Water sample |
C1 |
C2 |
C3 |
C4 |
C5 |
| pH |
8.4 |
8.4 |
8.8 |
8.8 |
7.8 |
| Ammonia (mg/L) |
0.25 |
0.375 |
0.25 |
0.25 |
0.25 |
| Nitrite (ppm) |
0 |
0.125 |
0 |
0 |
0 |
| Nitrate (ppm) |
10 |
20 |
10 |
10 |
20 |
| Water sample |
S1 |
S2 |
S3 |
S4 |
S5 |
| pH |
8.4 |
8.4 |
8.6 |
8.4 |
8.4 |
| Ammonia (mg/L) |
0.25 |
0.25 |
0.25 |
0.5 |
0.25 |
| Nitrite (ppm) |
0 |
0 |
0 |
0 |
0 |
| Nitrate (ppm) |
5 |
5 |
5 |
10 |
5 |
| Water sample |
Filtered seawater |
| pH |
7.4 |
| Ammonia (mg/L) |
0 |
| Nitrite (ppm) |
0 |
| Nitrate (ppm) |
120 |
